BI-as-a-Service for Industrial SMEs

Your outsourced data team — live in 15 days.

Stop chasing numbers across Excel files and ERP exports. We connect your data, build your dashboards and give you an AI assistant that answers your business questions — without hiring an analyst.

Request a Pilot

Or explore the live demo

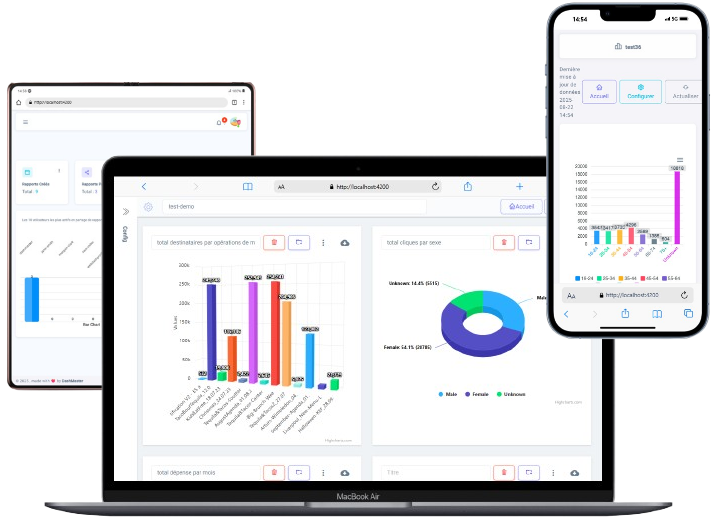
DashMaster dashboard on laptop and mobile

AI Assistant

Just ask, in plain language

15 days

from kickoff to live dashboards

0

analysts to hire or train

800M+

rows queried in milliseconds

70–90%

smaller data footprint

See It in Action

Many locations. Many systems. One dashboard.

Each store, plant or warehouse often runs its own software. DashMaster connects them all, centralizes the data in one warehouse and gives you a single consolidated view — updated automatically.

ETL Pipeline

Extract · Clean · Load

12,480 rows/s

Data Warehouse

One source of truth

48,200,000 rows

OLAP Cube

Pre-calculated KPIs

38 ms / query

Live

AI insight:

Sounds familiar?

See what changes for your team.

ERP CRM sales_v3.xlsx stock.csv POS email

6 sources · 1 view

"Our numbers live in the ERP, the CRM and a dozen Excel files. Nobody has the full picture."

Every source connected. One version of the truth for the whole company.

Mon
Tue
Wed
Thu
Fri
Sat
Sun

Building monthly report… day 1/7

Monthly report · Live

Refreshed 2 min ago

"The monthly report takes a week to build — and it's already out of date when it arrives."

Reports update themselves. Always current, zero manual work.

Back to Excel Month 1 Month 6 Day 15: live Day 1 Month 6 ADOPTION

"We tried a BI project once. Six months later, everyone was back on Excel."

Live in 15 days with a zero-risk pilot, and run by us so it keeps working.

0%

All sources

of company data is never used for analytics (Forrester: 60–73%). You're not alone.

DashMaster puts every source to work — in one dashboard your whole team can use.

Used Never analyzed
AI Assistant

Describe the chart you need. Get it in seconds.

No SQL, no pivot tables, no waiting for IT. Ask in plain language — the AI assistant finds the right measures, dimensions and filters in your data model and builds the chart for you.

  • Creates new charts or edits existing ones: "switch to a donut", "add region"
  • Speaks your business language and maps it to your own KPIs
  • Picks the best of 20 chart types: columns, lines, pies, radar, 3D or tables
  • Private by design: the AI works on your data model and never sees your figures

DashMaster AI

Connected to ERP · CRM · Production

Live example
Describe the chart you need…
Use Cases

One source of truth for every team

Everyone sees the same numbers — each with the KPIs that matter to their job.

How It Works

From raw data to decisions in 15 days

We do the work. Your IT team only grants data access.

Days 1–4

Source Inspection

We map your ERP, CRM, production and Excel sources.

Days 5–6

Automated Pipeline

Your data is collected and cleaned automatically.

Days 7–12

Data Warehouse

One unified model — a single source of truth.

Days 13–14

Analytics Cube

Pre-calculated figures for instant answers.

Day 15

Go Live + AI

Dashboards and AI assistant on your real data.

Why DashMaster

Tried BI before? This time it works.

Classic BI project DIY with ChatGPT DashMaster
Time to first dashboard 3–6 months Hours, on one file 15 days, on all your data
Connects all your systems After heavy integration Manual exports Automated pipeline
Reliable on large volumes Breaks at scale 800M+ rows in ms
Needs in-house expertise BI team required Someone must prepare data None — we run it
Charts on demand, in plain language On flat data only On your own KPIs
Proof before you commit — Zero-risk pilot
Ahmed Walha
Who We Are

"Industrial SMEs have the data to make great decisions — they just can't see it. We built DashMaster so any company can have a data team, without building one."

Ahmed Walha

CEO & Co-Founder · DashMaster, Sfax, Tunisia

Connect on LinkedIn
FAQ

Common questions

Which systems can you connect to?

ERP, CRM, production and warehouse management systems, SQL databases, and Excel or CSV files. We inspect your sources during the first days of the project.

What do you need from our IT team?

Read access to the data sources for the chosen subject. We build and run the pipeline, the warehouse, the cube and the dashboards ourselves.

Do we need BI skills to use DashMaster?

No. Your team describes the chart they need in plain language, for example "sales by region for 2025". The AI assistant picks the right measures, dimensions, filters and chart type, and can edit any existing chart on request.

Can we keep using Power BI or our own AI tools?

Yes. DashMaster exposes your structured data through an MCP-ready API and a Power BI connector, so it works with the tools you already use.

What happens after the pilot?

If you're convinced, we extend DashMaster to more subjects, KPIs, data sources and users. If not, you've lost nothing.

Request a pilot

Tell us about your company and the data you'd like to see. We'll get back to you within 48 hours.